> ## Documentation Index
> Fetch the complete documentation index at: https://docs.callkaro.ai/llms.txt
> Use this file to discover all available pages before exploring further.
# Trial Table
> View detailed trial statistics for batch calls
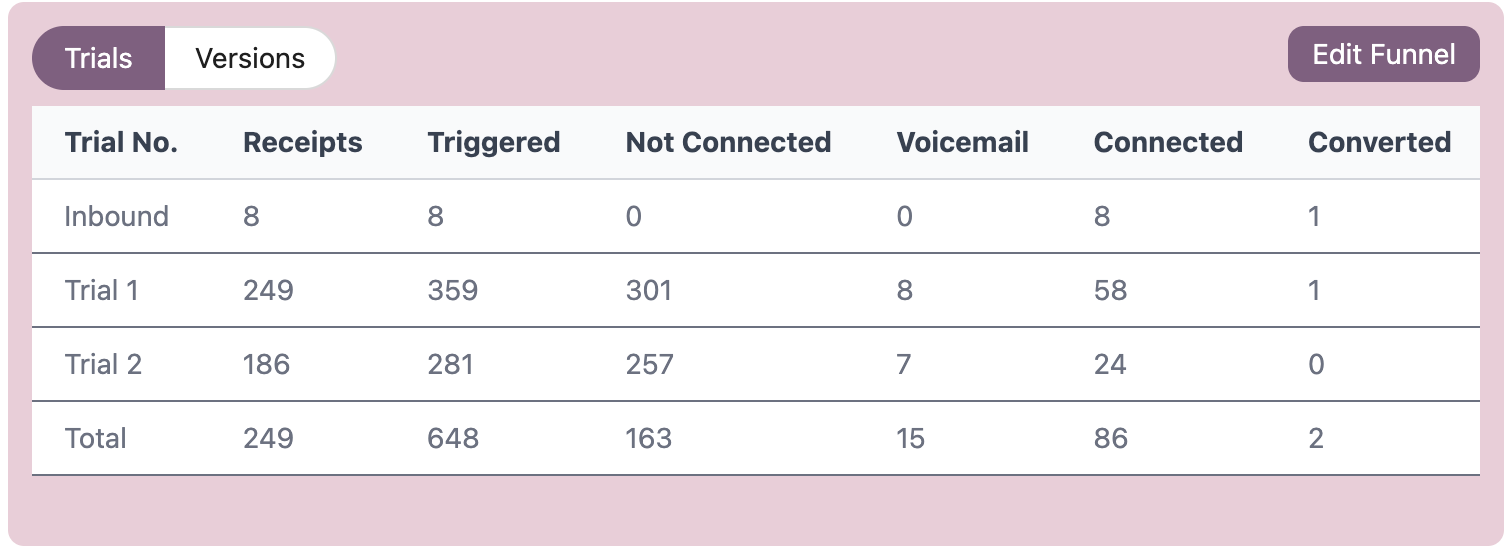
## What is the Trial Table?
The Trial Table shows detailed statistics for each retry attempt in a batch call campaign. Each row represents a different trial number, tracking how many calls were triggered, connected, and converted for that specific attempt.
## Accessing the Trial Table
Navigate to a batch call dashboard to see the trial table:
**Dashboard → Batch Calls → \[Select Batch] → Batch Call Dashboard**
 ## Table Columns
| Column | Description |
| -------------------------------- | ------------------------------------------------------------------------------------------------------- |
| **Trial No.** | The retry attempt number (Trial 1 = first attempt, Trial 2 = first retry, Trial 3 = second retry, etc.) |
| **Receipts** | Total number of unique contacts for this trial |
| **Triggered** | Number of calls initiated in this trial |
| **Not Connected** | Number of calls where contact didn't pick up (busy, no answer, rejected, etc.) |
| **Voicemail** | Number of calls that reached voicemail |
| **Connected** | Number of calls where the contact picked up |
| **\[Funnel Metrics]** | Dynamic columns showing counts for each funnel metric selected during batch creation |
| **Converted** | Number of successful conversions in this trial |
| **Connected to Conversion Rate** | Percentage of connected calls that converted |
| **Receipt to Conversion Rate** | Percentage of total receipts that converted |
| **Funnel View** | Click **View** to see the funnel chart for this specific trial |
## Total Row
The bottom row shows cumulative statistics across all trials:
* **Receipts** - Shows unique count from Trial 1 only (total contacts in batch)
* **Not Connected** - Total unique not connected receipts
* **Connected** - Total unique connected receipts across all trials
## How Trials Work
Trials represent retry attempts for batch calls:
* **Trial 1** - Initial call attempt to all contacts
* **Trial 2** - First retry to contacts who didn't connect
* **Trial 3** - Second retry to contacts who didn't connect
* And so on...
## Understanding Conversion Rates
**Connected to Conversion Rate** = (Converted Calls / Connected Calls) × 100
* Shows how effective your agent is at converting people who pick up
**Receipt to Conversion Rate** = (Converted Calls / Total Receipts) × 100
* Shows overall campaign effectiveness including non-answers
Each trial only includes contacts who didn't successfully connect in previous trials.
Use the **Funnel View** to see the visual funnel chart for each trial, helping you understand drop-off points in your conversion process.
## Table Columns
| Column | Description |
| -------------------------------- | ------------------------------------------------------------------------------------------------------- |
| **Trial No.** | The retry attempt number (Trial 1 = first attempt, Trial 2 = first retry, Trial 3 = second retry, etc.) |
| **Receipts** | Total number of unique contacts for this trial |
| **Triggered** | Number of calls initiated in this trial |
| **Not Connected** | Number of calls where contact didn't pick up (busy, no answer, rejected, etc.) |
| **Voicemail** | Number of calls that reached voicemail |
| **Connected** | Number of calls where the contact picked up |
| **\[Funnel Metrics]** | Dynamic columns showing counts for each funnel metric selected during batch creation |
| **Converted** | Number of successful conversions in this trial |
| **Connected to Conversion Rate** | Percentage of connected calls that converted |
| **Receipt to Conversion Rate** | Percentage of total receipts that converted |
| **Funnel View** | Click **View** to see the funnel chart for this specific trial |
## Total Row
The bottom row shows cumulative statistics across all trials:
* **Receipts** - Shows unique count from Trial 1 only (total contacts in batch)
* **Not Connected** - Total unique not connected receipts
* **Connected** - Total unique connected receipts across all trials
## How Trials Work
Trials represent retry attempts for batch calls:
* **Trial 1** - Initial call attempt to all contacts
* **Trial 2** - First retry to contacts who didn't connect
* **Trial 3** - Second retry to contacts who didn't connect
* And so on...
## Understanding Conversion Rates
**Connected to Conversion Rate** = (Converted Calls / Connected Calls) × 100
* Shows how effective your agent is at converting people who pick up
**Receipt to Conversion Rate** = (Converted Calls / Total Receipts) × 100
* Shows overall campaign effectiveness including non-answers
Each trial only includes contacts who didn't successfully connect in previous trials.
Use the **Funnel View** to see the visual funnel chart for each trial, helping you understand drop-off points in your conversion process.