> ## Documentation Index
> Fetch the complete documentation index at: https://docs.callkaro.ai/llms.txt
> Use this file to discover all available pages before exploring further.
# KPI Manager Dashboard
> Charts, RCA reports, and the day-wise timeline
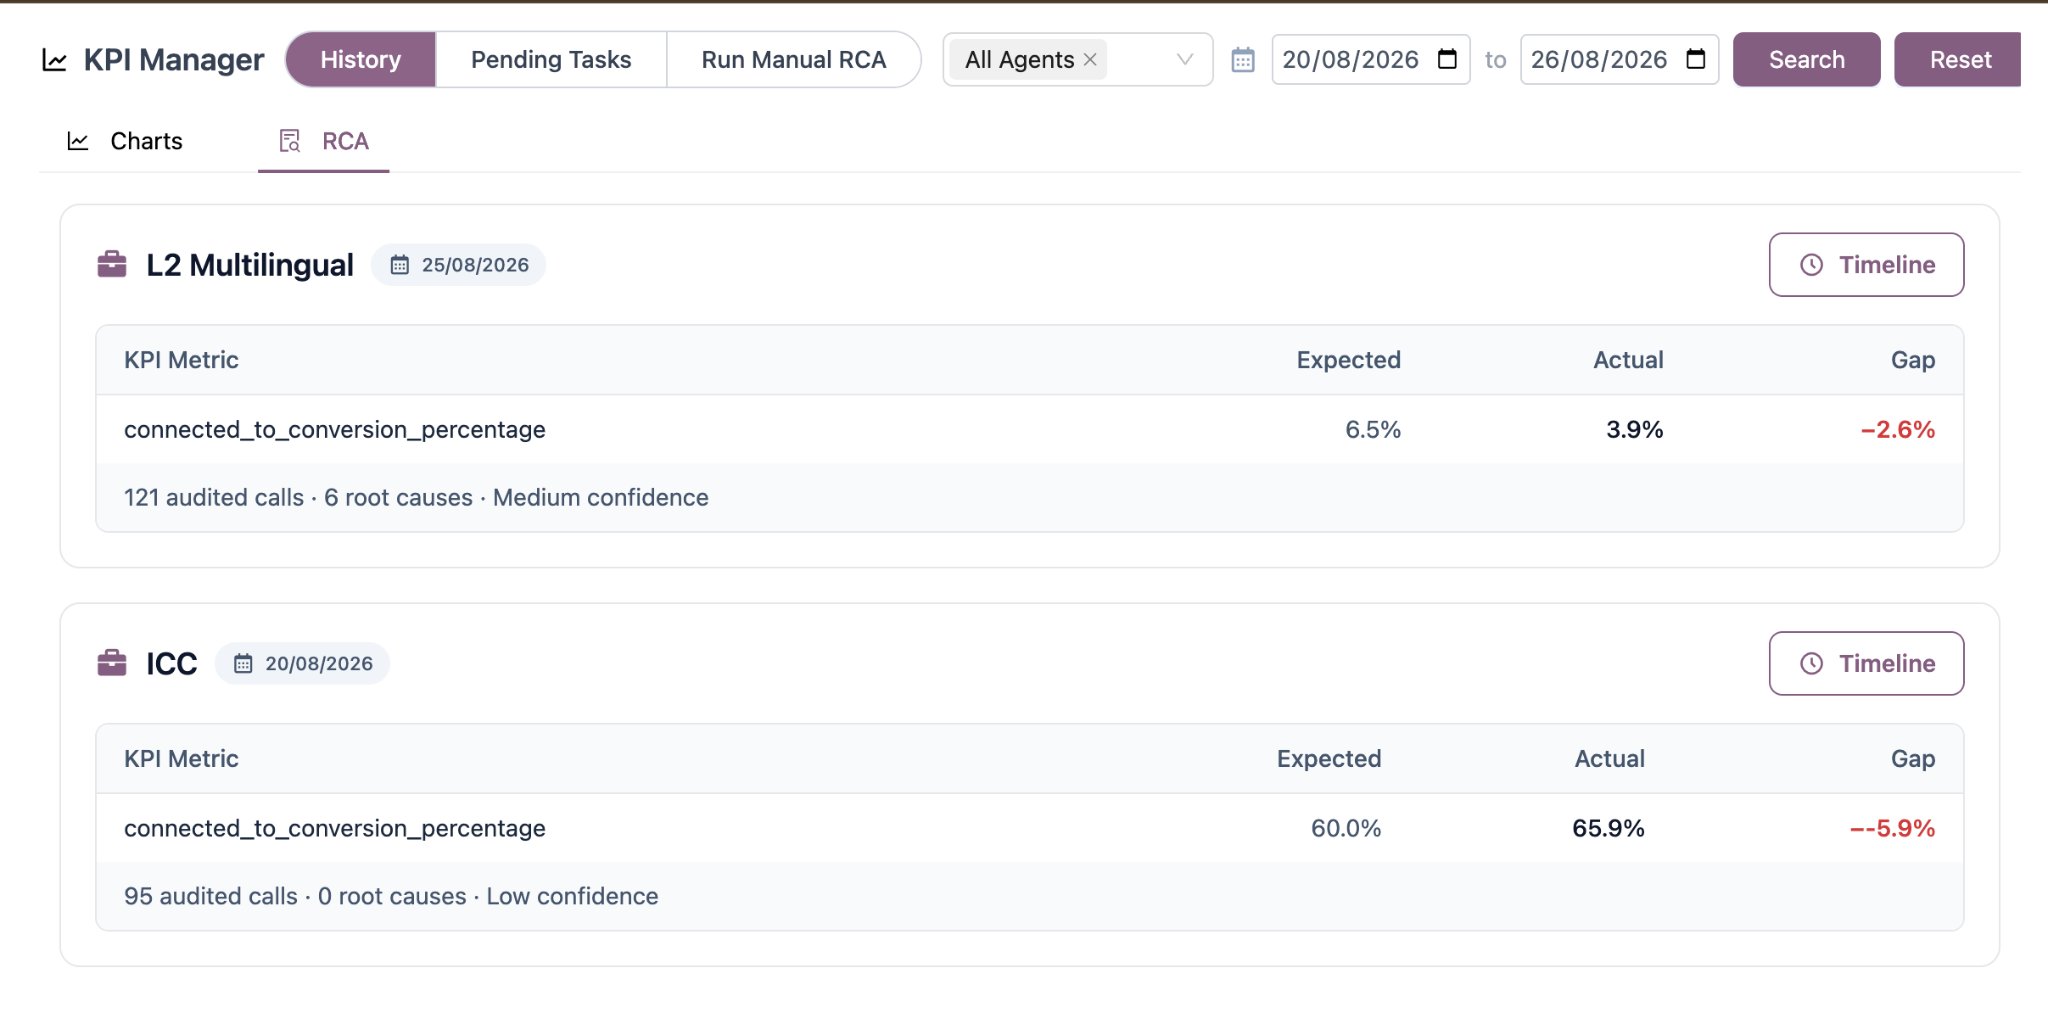
Open **KPI Manager** from the sidebar. The dashboard covers every agent you have configured, and is organised into three views selected by the pill control at the top.
| View | Shows |
| ------------------ | ---------------------------------------------------------------------------------------- |
| **History** | Two sub-tabs: **Charts** (metric trends over time) and **RCA** (the reports themselves). |
| **Pending Tasks** | The work board where root causes become tracked, assignable tasks. |
| **Run Manual RCA** | An on-demand analysis over a call set you choose yourself. |
## The shared filter
The top-right filter bar drives History and Pending Tasks together: pick one or more agents (or **All Agents**), set a start and end date, then select **Search**. Nothing reloads until you select Search, so you can set up the whole filter before fetching. **Reset** returns to all agents over the last seven days.
The filter is hidden on Run Manual RCA, which has its own controls.
 ## History → Charts
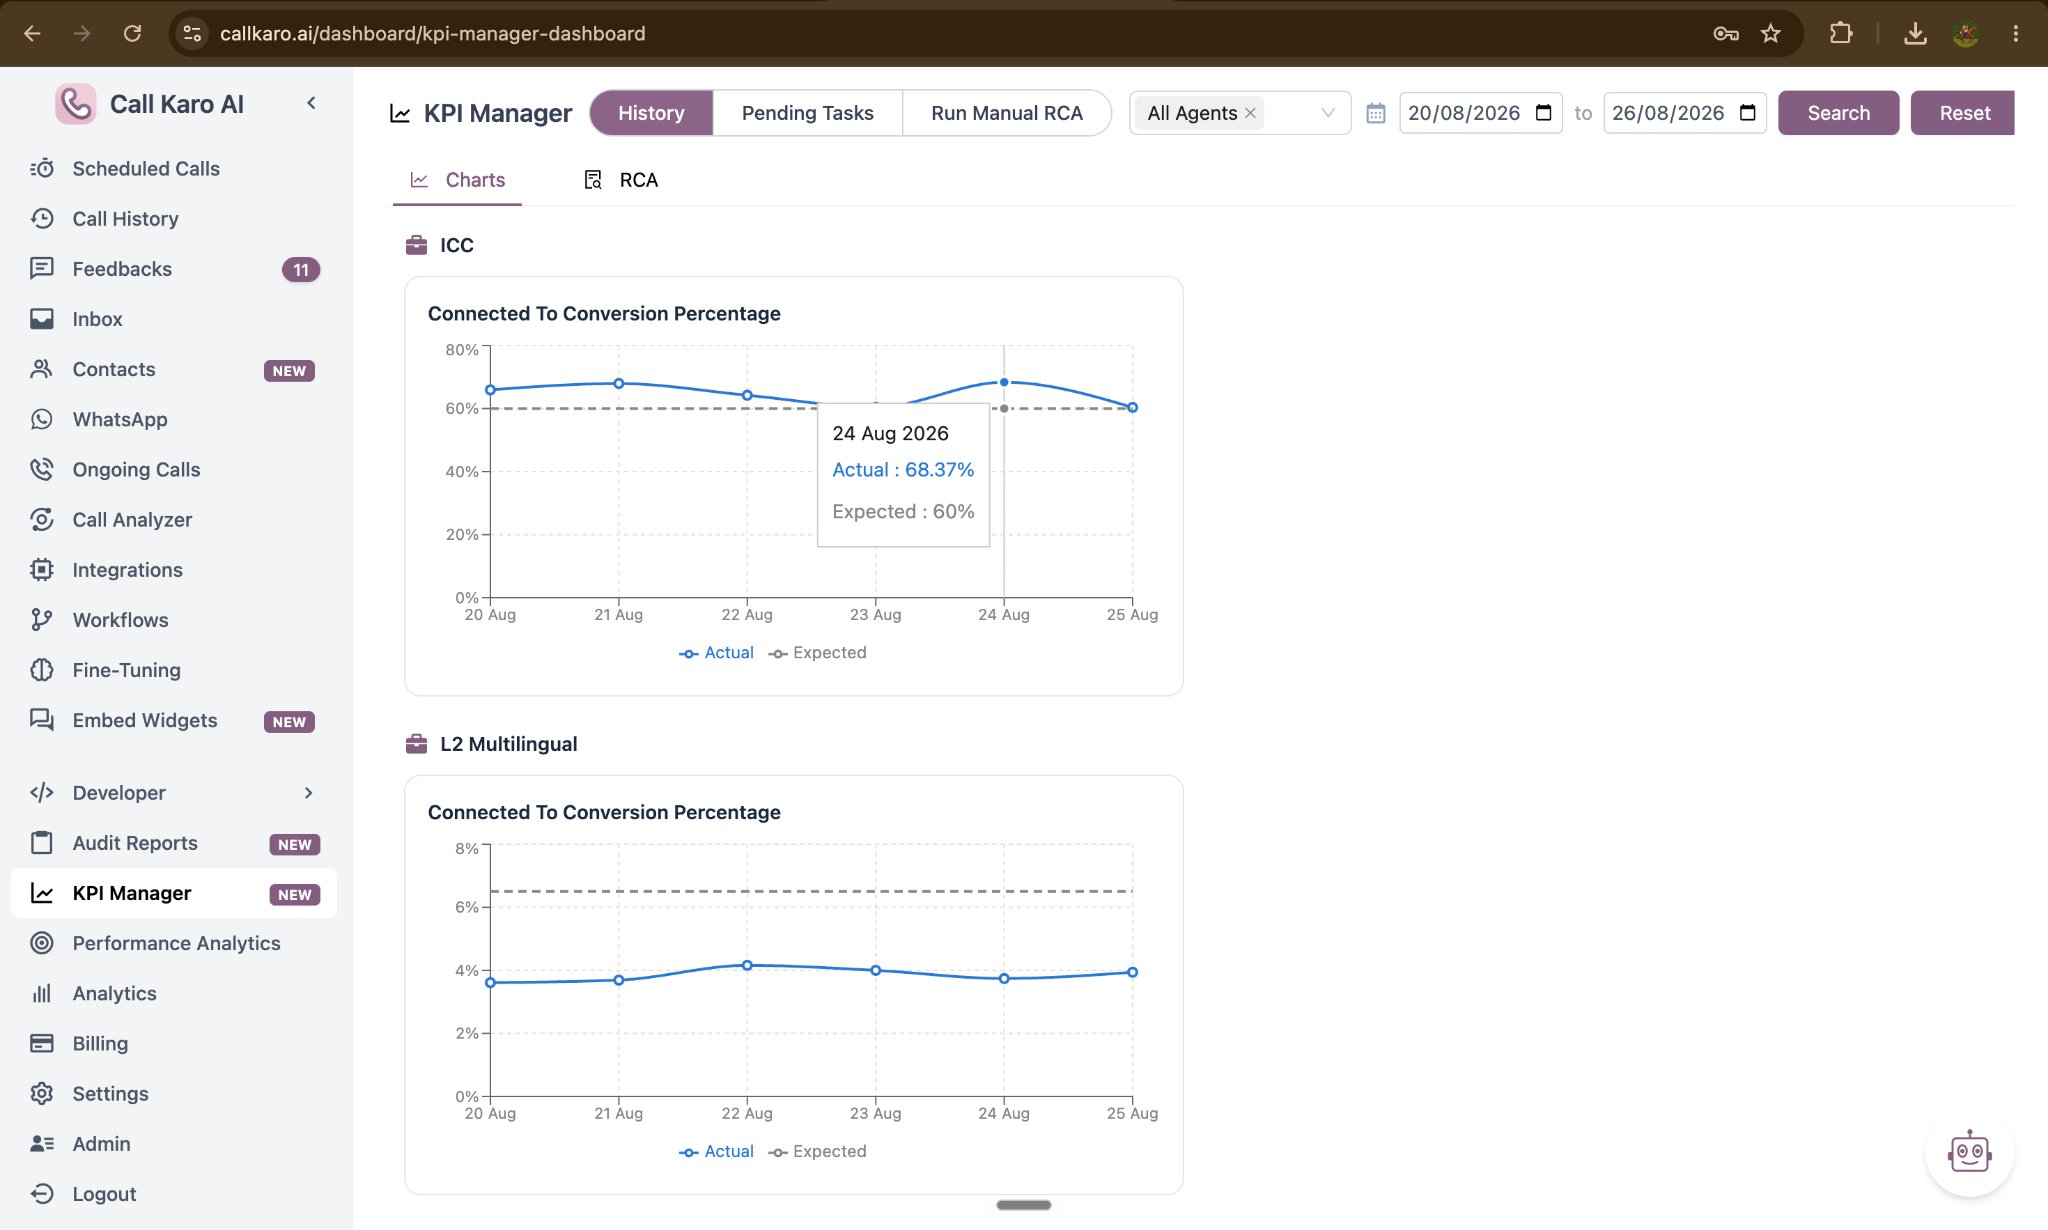
A time-series chart per agent, per metric, plotting the **actual** value against its **target** for each day in the range. This is where you see whether a fix moved the number, and whether a dip was a one-day event or a trend.
## History → Charts
A time-series chart per agent, per metric, plotting the **actual** value against its **target** for each day in the range. This is where you see whether a fix moved the number, and whether a dip was a one-day event or a trend.
 ## History → RCA
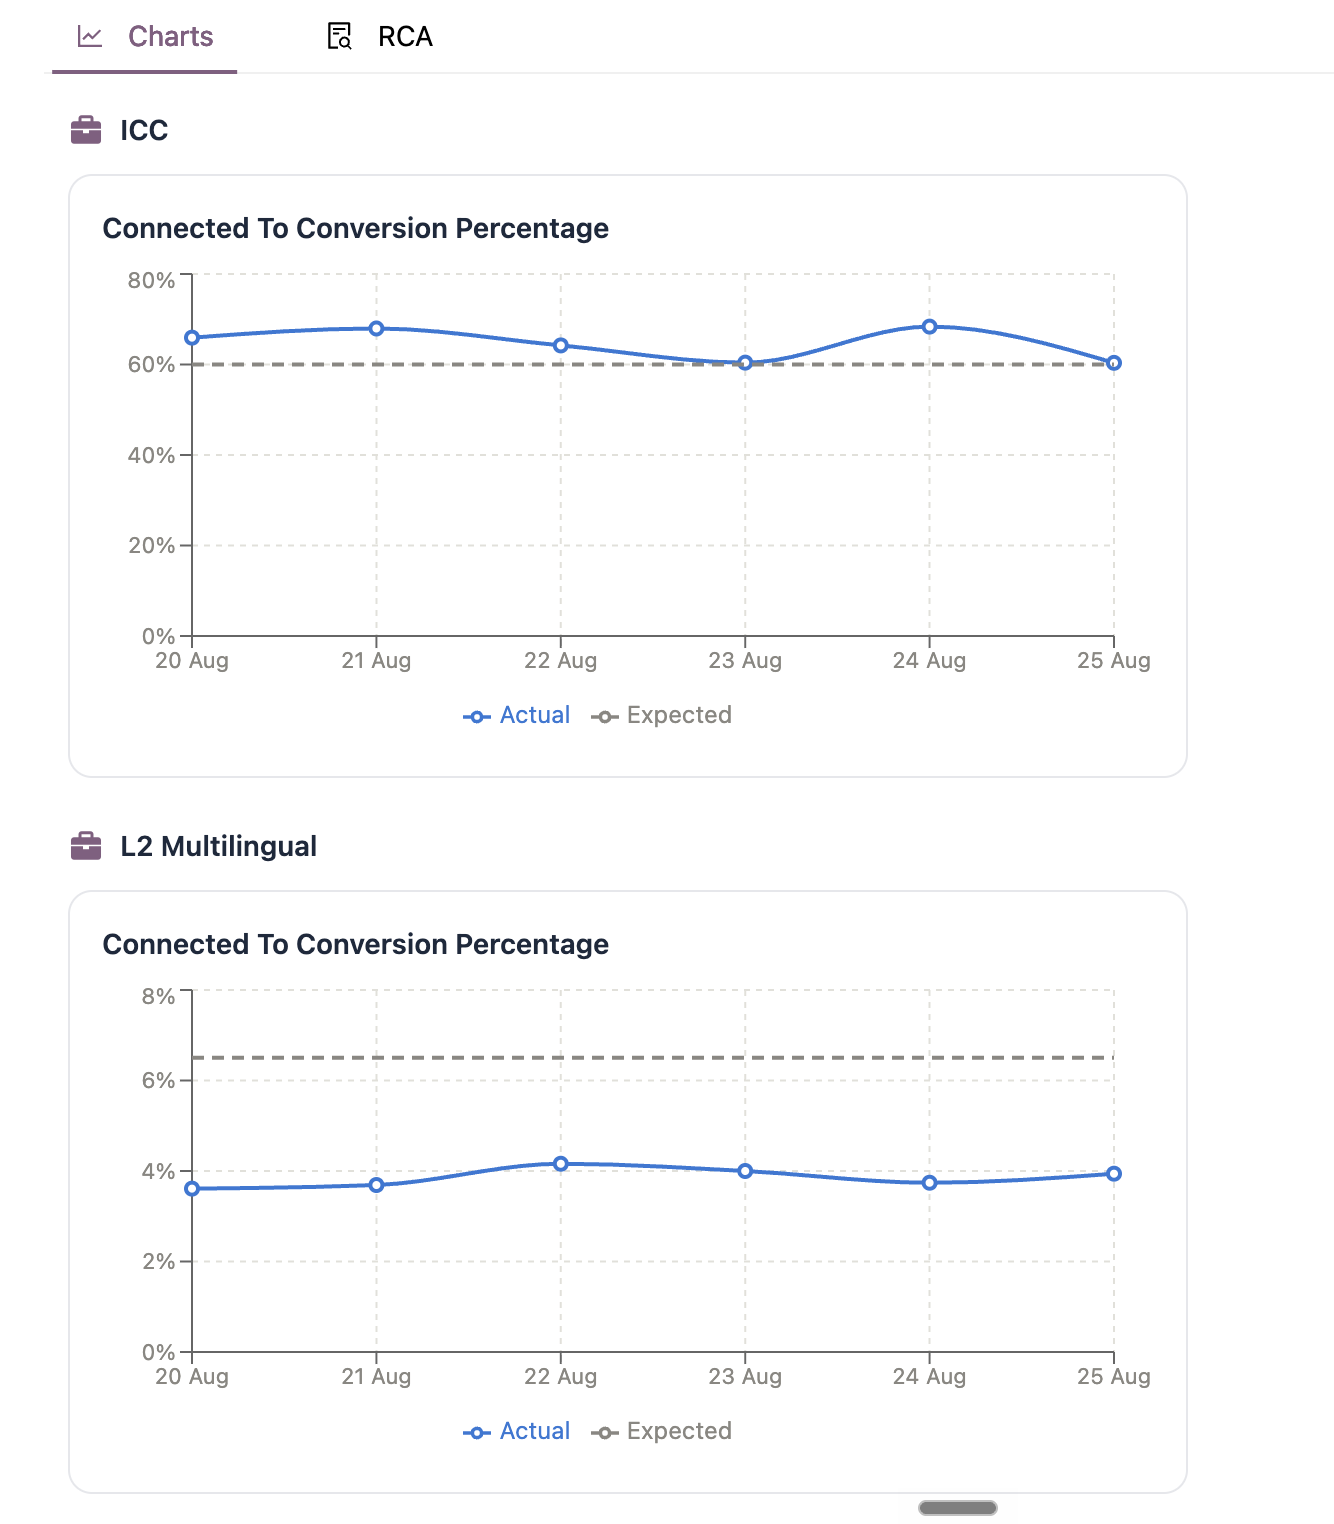
One card per agent per day that produced a report. Each card shows:
* The agent name and the day the report covers.
* A **metrics table** listing every missed metric with its **Expected**, **Actual** and **Gap**.
* Whether the report came from the **Automatic** daily run or a **Manual** one.
* A **day-wise timeline** of the pipeline behind the number — every data source called, every metric evaluated, and every decision the system made, each tagged Done, Attention, Failed, Skipped or Info.
* **Preview** and **Download** for the full PDF report.
## History → RCA
One card per agent per day that produced a report. Each card shows:
* The agent name and the day the report covers.
* A **metrics table** listing every missed metric with its **Expected**, **Actual** and **Gap**.
* Whether the report came from the **Automatic** daily run or a **Manual** one.
* A **day-wise timeline** of the pipeline behind the number — every data source called, every metric evaluated, and every decision the system made, each tagged Done, Attention, Failed, Skipped or Info.
* **Preview** and **Download** for the full PDF report.
 **The timeline is your debugging tool.** If a metric was not measured, or an analysis did not run, the timeline says exactly why in plain English — an endpoint that failed, a value that never came back, a prompt that did not cover the metric, or Auto RCA being off.
### Previewing a report
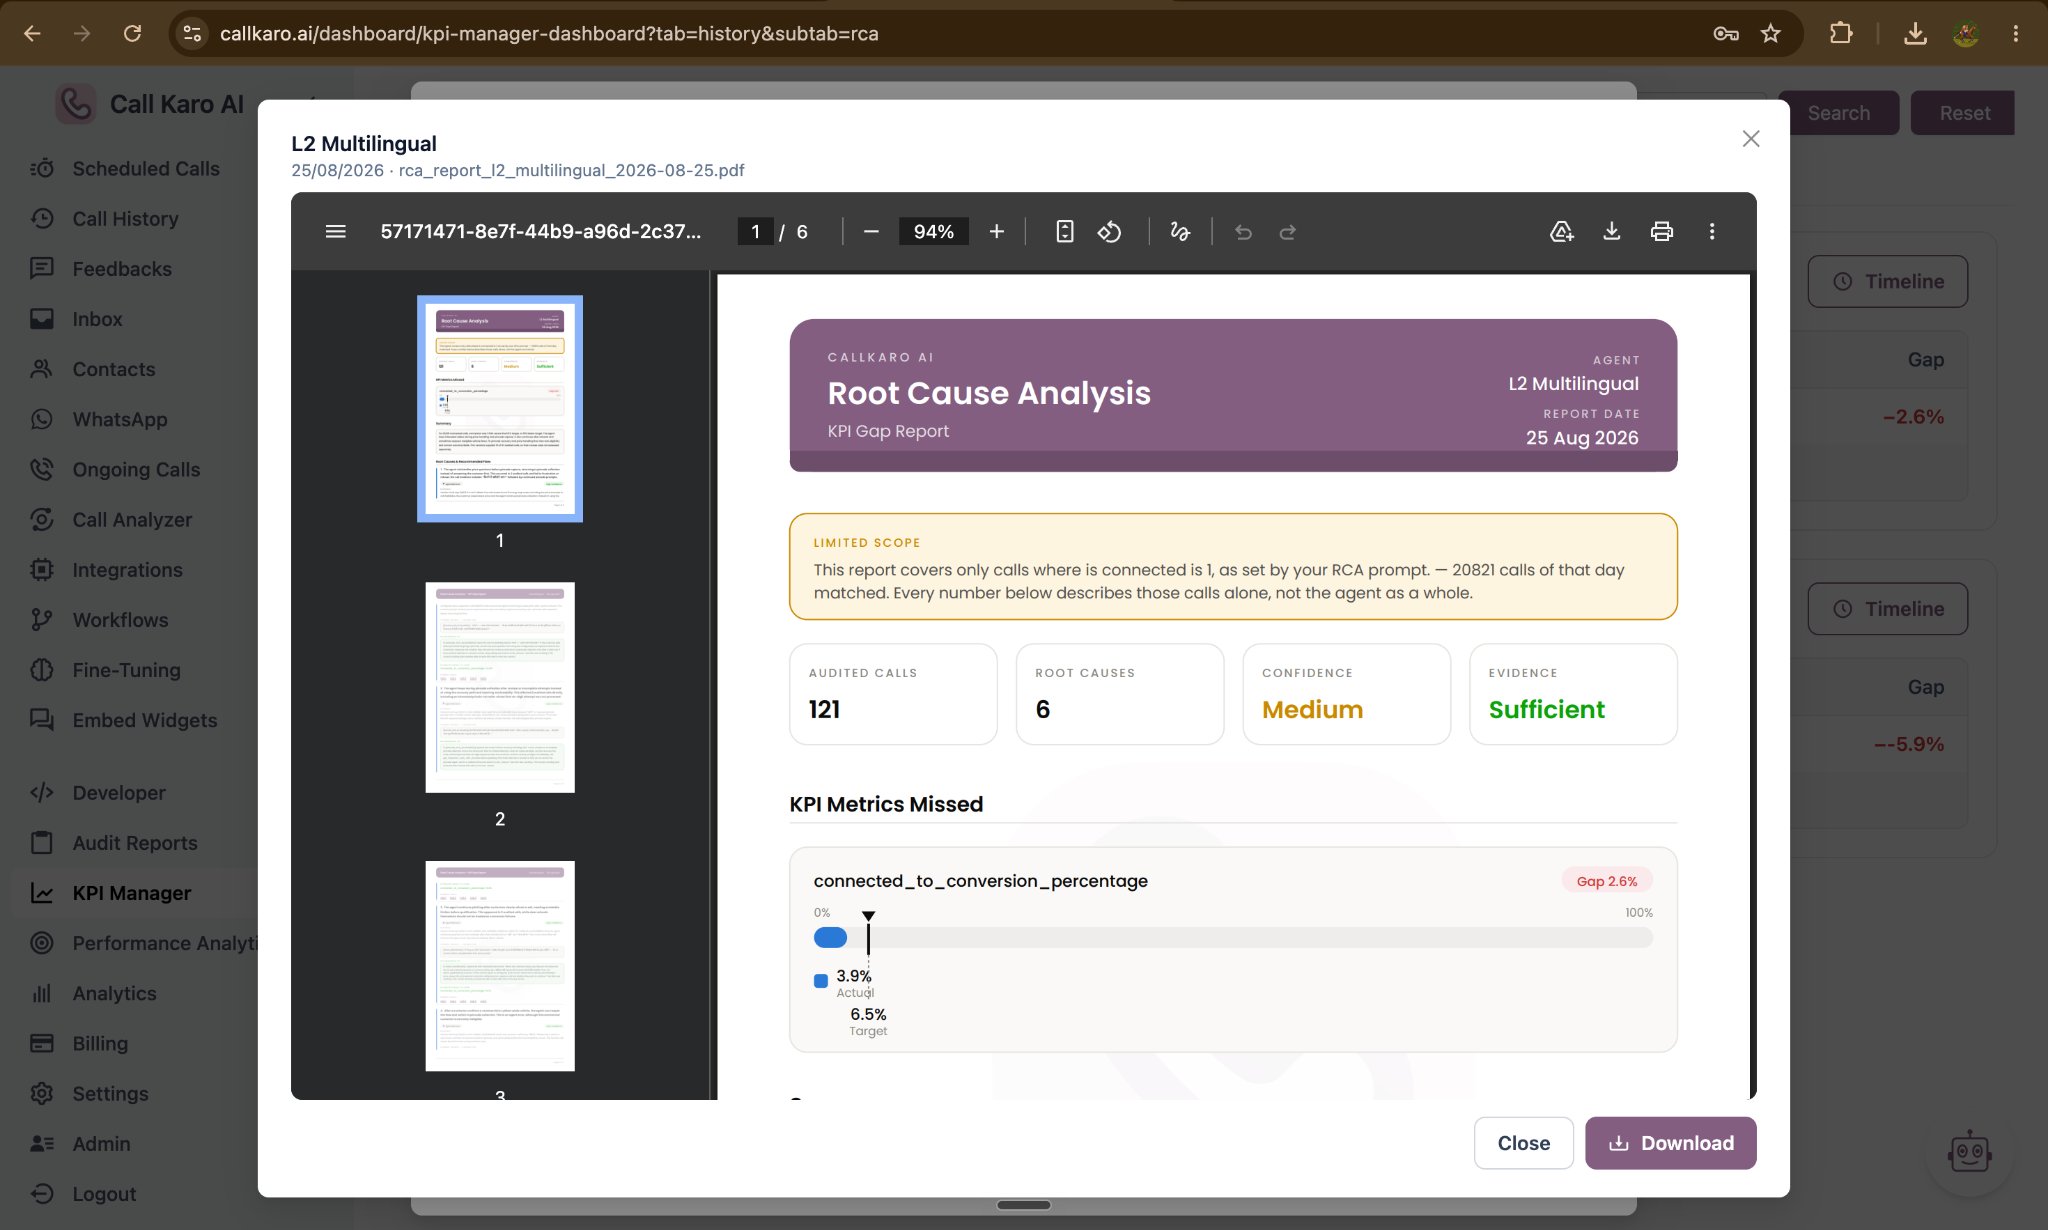
Select **Preview** to read the full PDF without leaving the dashboard, or **Download** to save a copy.
**The timeline is your debugging tool.** If a metric was not measured, or an analysis did not run, the timeline says exactly why in plain English — an endpoint that failed, a value that never came back, a prompt that did not cover the metric, or Auto RCA being off.
### Previewing a report
Select **Preview** to read the full PDF without leaving the dashboard, or **Download** to save a copy.