What is the Trial Table?
The Trial Table shows detailed statistics for each retry attempt in a batch call campaign. Each row represents a different trial number, tracking how many calls were triggered, connected, and converted for that specific attempt.Accessing the Trial Table
Navigate to a batch call dashboard to see the trial table: Dashboard → Batch Calls → [Select Batch] → Batch Call Dashboard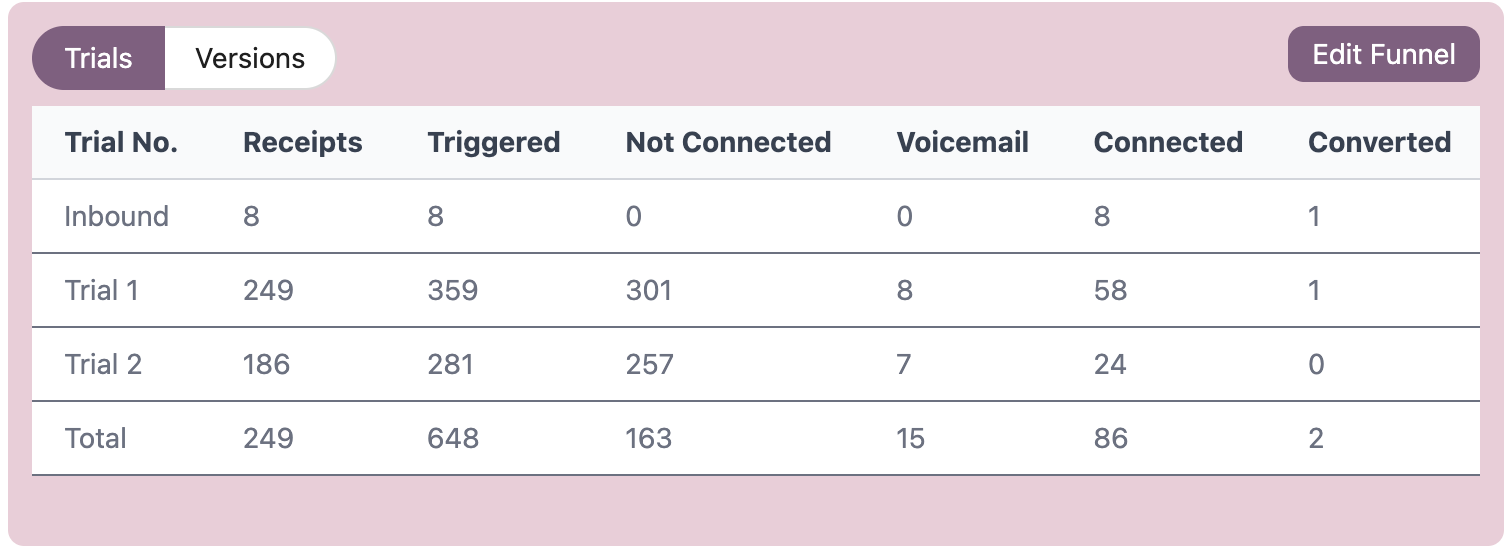
Table Columns
Total Row
The bottom row shows cumulative statistics across all trials:- Receipts - Shows unique count from Trial 1 only (total contacts in batch)
- Not Connected - Total unique not connected receipts
- Connected - Total unique connected receipts across all trials
How Trials Work
Trials represent retry attempts for batch calls:- Trial 1 - Initial call attempt to all contacts
- Trial 2 - First retry to contacts who didn’t connect
- Trial 3 - Second retry to contacts who didn’t connect
- And so on…
Understanding Conversion Rates
Connected to Conversion Rate = (Converted Calls / Connected Calls) × 100- Shows how effective your agent is at converting people who pick up
- Shows overall campaign effectiveness including non-answers
Each trial only includes contacts who didn’t successfully connect in previous trials.