What is the Version Table?
The Version Table shows call statistics grouped by agent version. This is useful when a batch uses multiple agents or when testing different AI agent versions to compare their performance.Accessing the Version Table
Navigate to a batch call dashboard to see the version table: Dashboard → Batch Calls → [Select Batch] → Batch Call Dashboard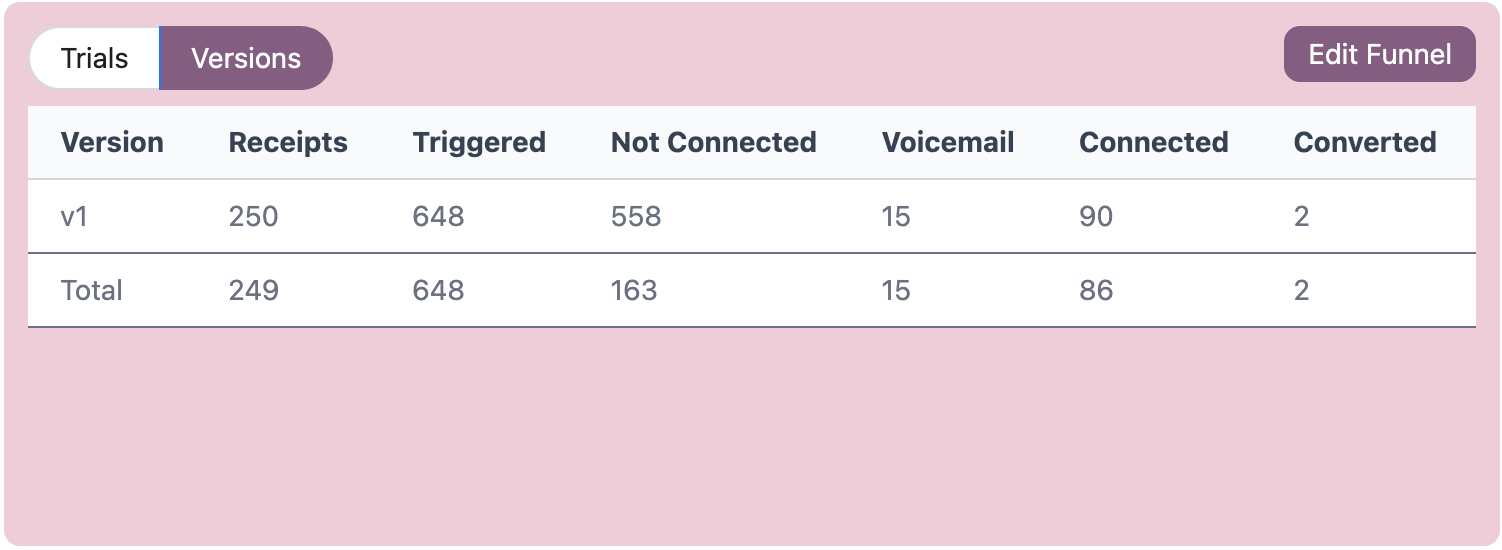
Table Columns
| Column | Description |
|---|---|
| Version | Agent version name used for the calls |
| Receipts | Total number of unique contacts called with this version |
| Triggered | Number of calls initiated using this version |
| Not Connected | Number of calls where contact didn’t pick up |
| Voicemail | Number of calls that reached voicemail |
| Connected | Number of calls where the contact picked up |
| [Funnel Metrics] | Dynamic columns showing counts for each funnel metric |
| Converted | Number of successful conversions with this version |
| Connected to Conversion Rate | Percentage of connected calls that converted |
| Receipt to Conversion Rate | Percentage of total receipts that converted |
Total Row
The bottom row shows cumulative statistics across all versions:- Receipts - Total unique receipts across all versions
- Not Connected - Total unique not connected receipts
- Connected - Total unique connected receipts
- All other columns sum the values from individual versions
Understanding Conversion Rates
Connected to Conversion Rate = (Converted Calls / Connected Calls) × 100- Shows how effective each version is at converting people who pick up
- Shows overall version effectiveness including non-answers