The shared filter
The top-right filter bar drives History and Pending Tasks together: pick one or more agents (or All Agents), set a start and end date, then select Search. Nothing reloads until you select Search, so you can set up the whole filter before fetching. Reset returns to all agents over the last seven days. The filter is hidden on Run Manual RCA, which has its own controls.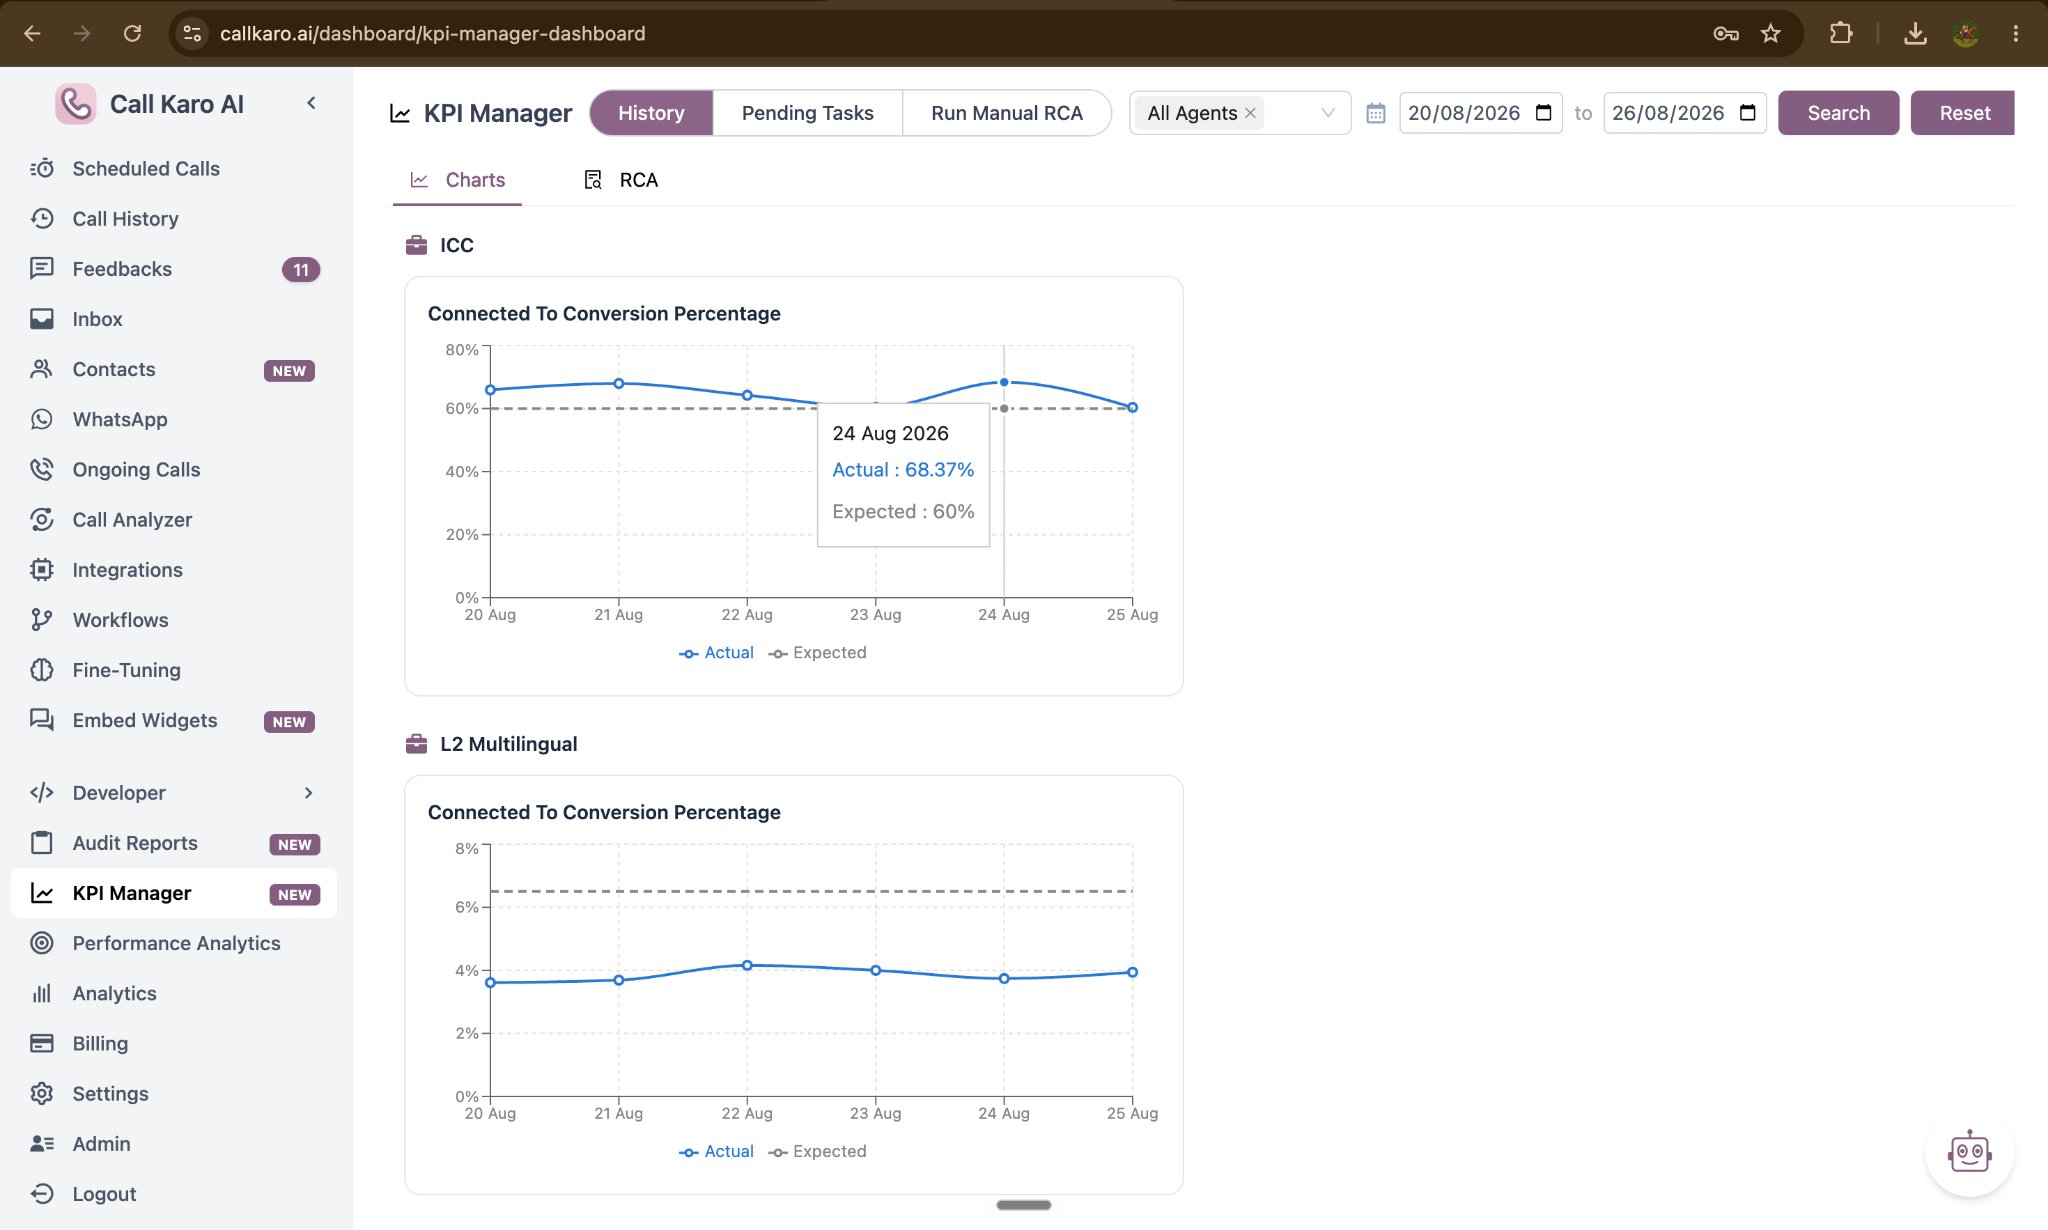
History → Charts
A time-series chart per agent, per metric, plotting the actual value against its target for each day in the range. This is where you see whether a fix moved the number, and whether a dip was a one-day event or a trend.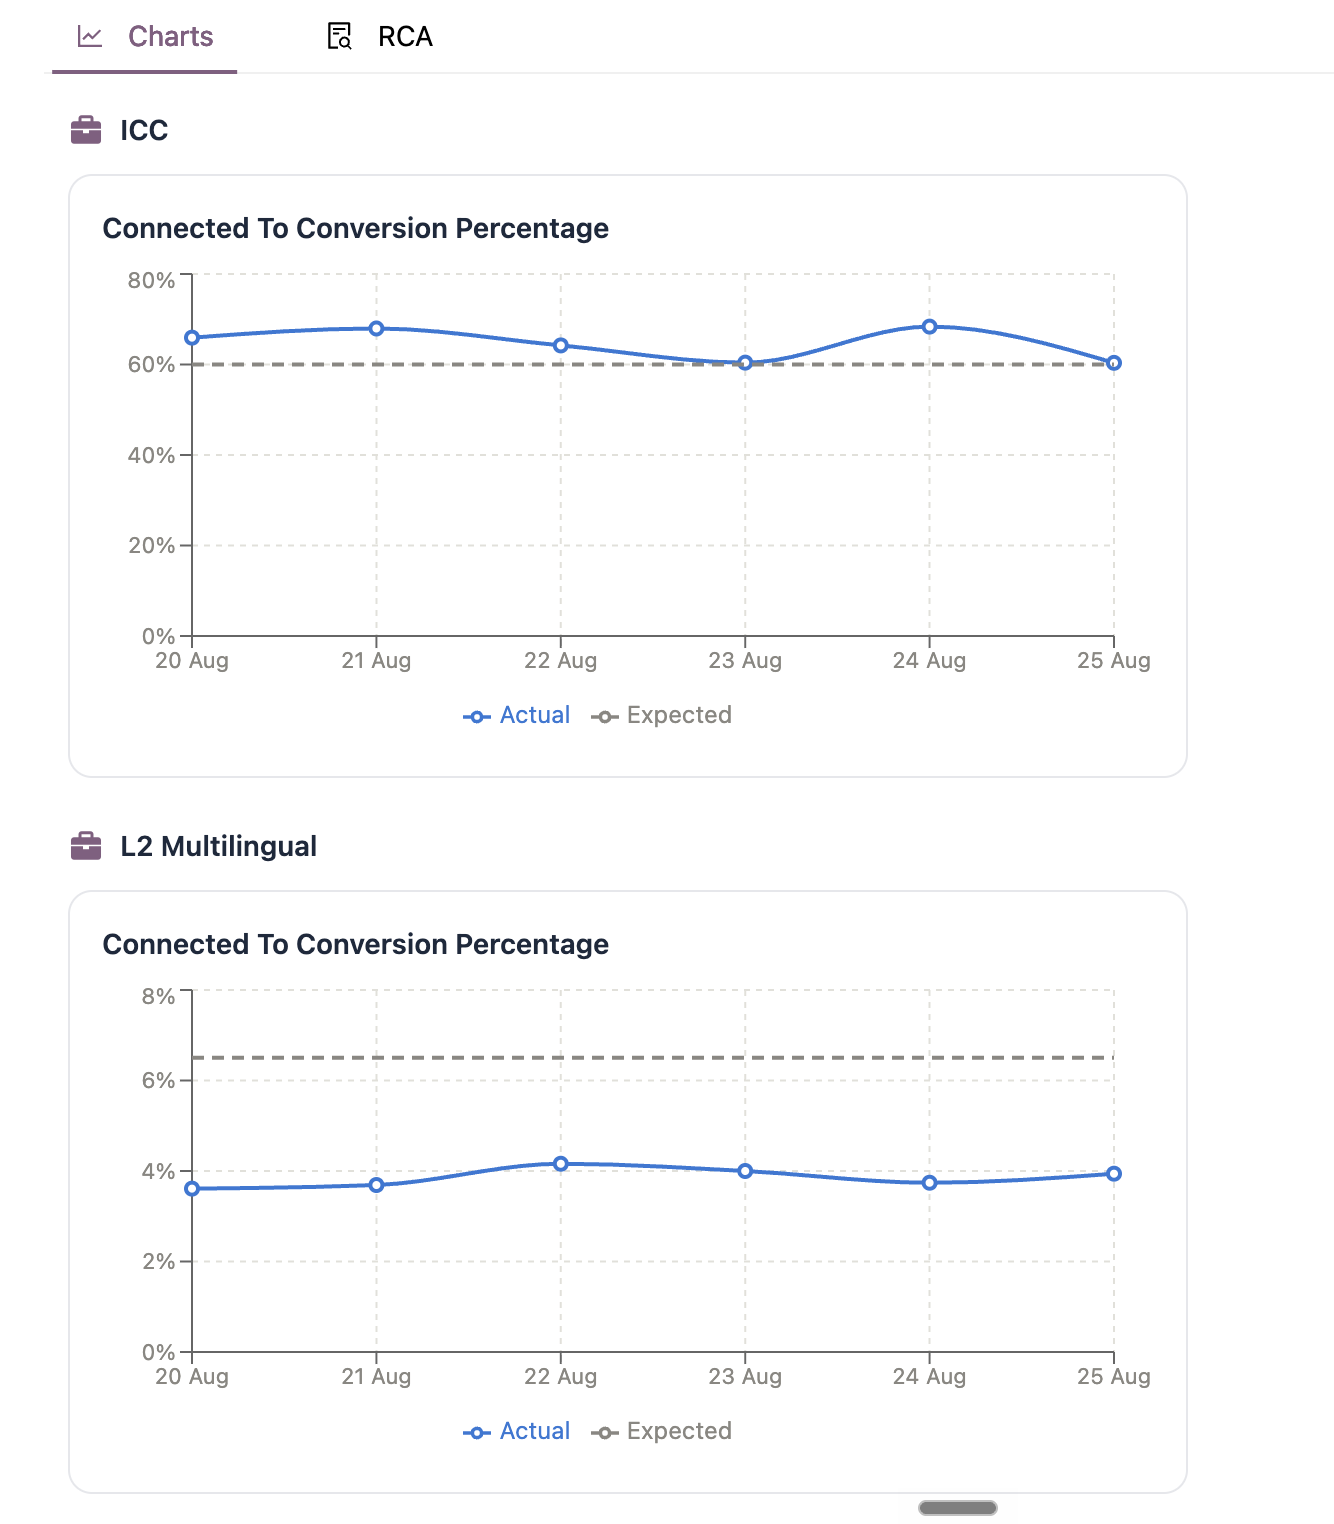
History → RCA
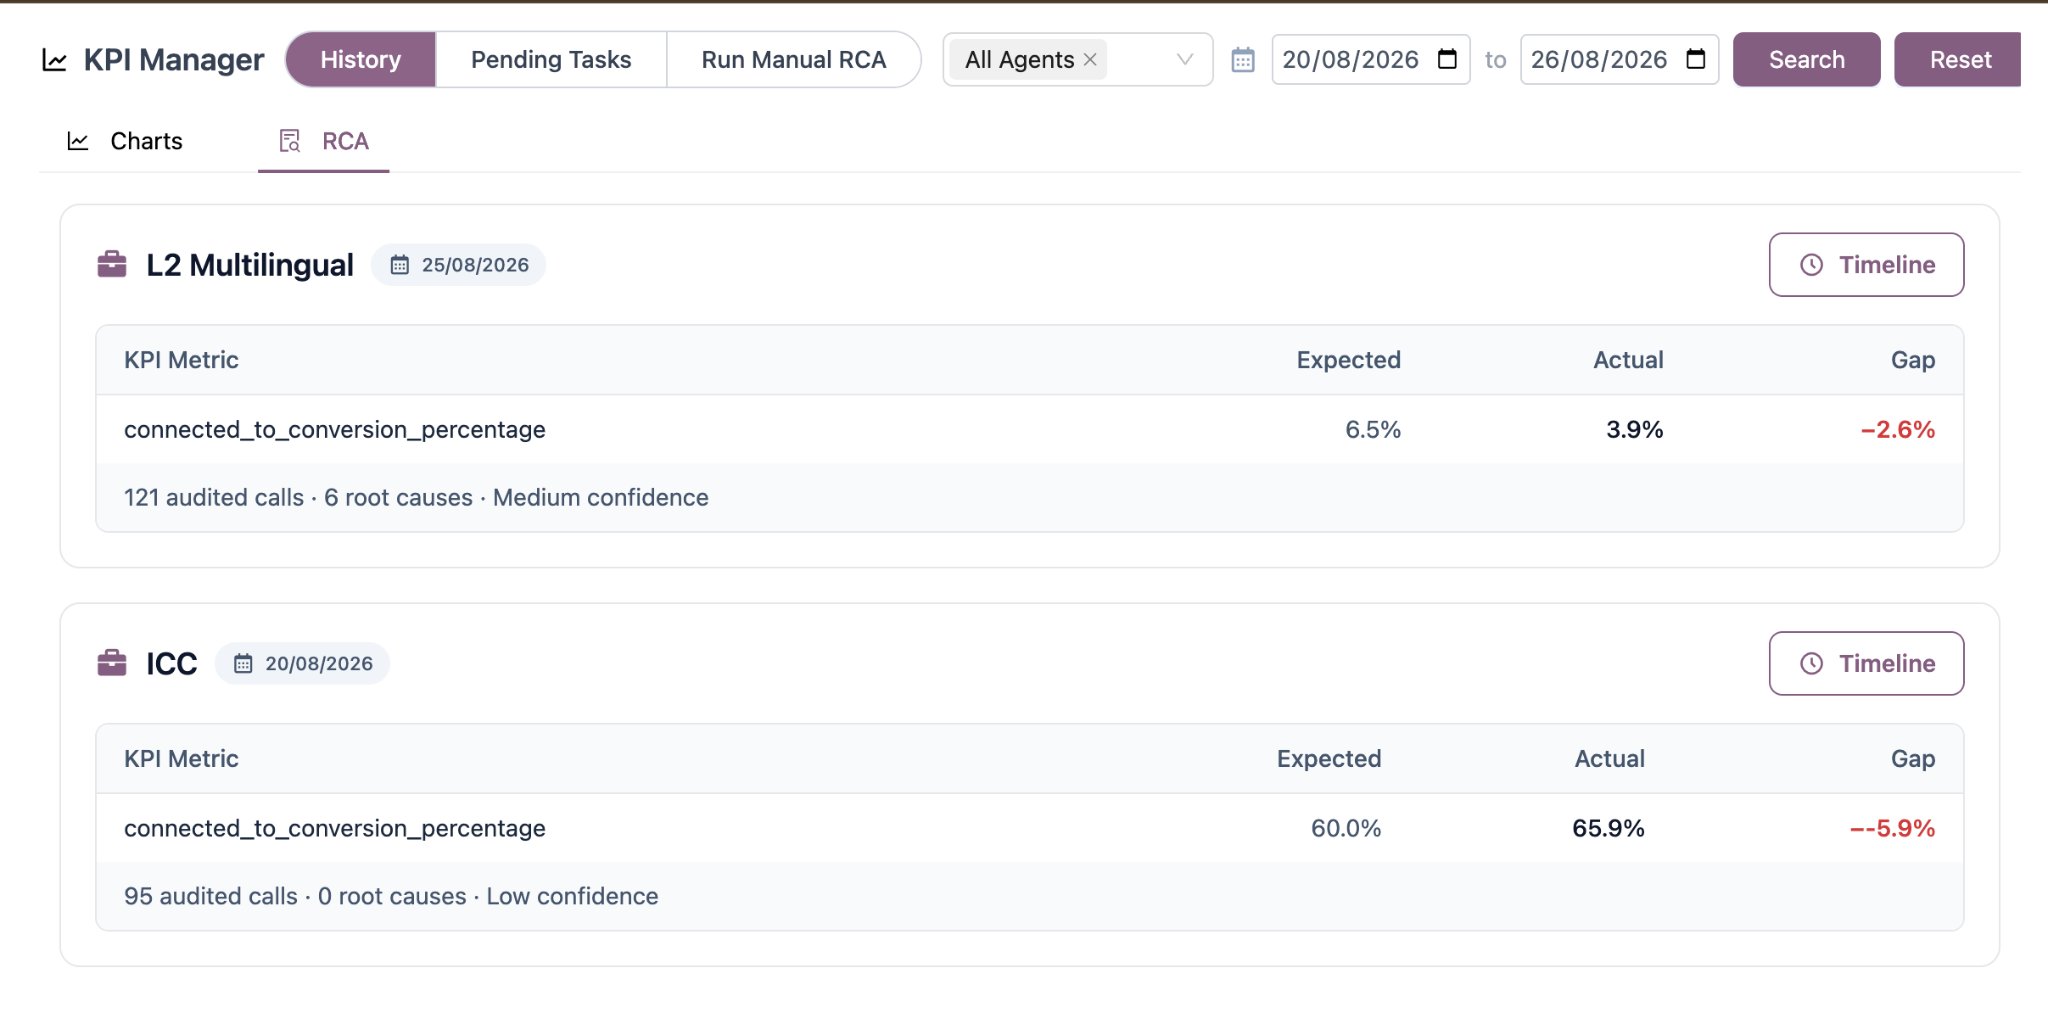
One card per agent per day that produced a report. Each card shows:- The agent name and the day the report covers.
- A metrics table listing every missed metric with its Expected, Actual and Gap.
- Whether the report came from the Automatic daily run or a Manual one.
- A day-wise timeline of the pipeline behind the number — every data source called, every metric evaluated, and every decision the system made, each tagged Done, Attention, Failed, Skipped or Info.
- Preview and Download for the full PDF report.
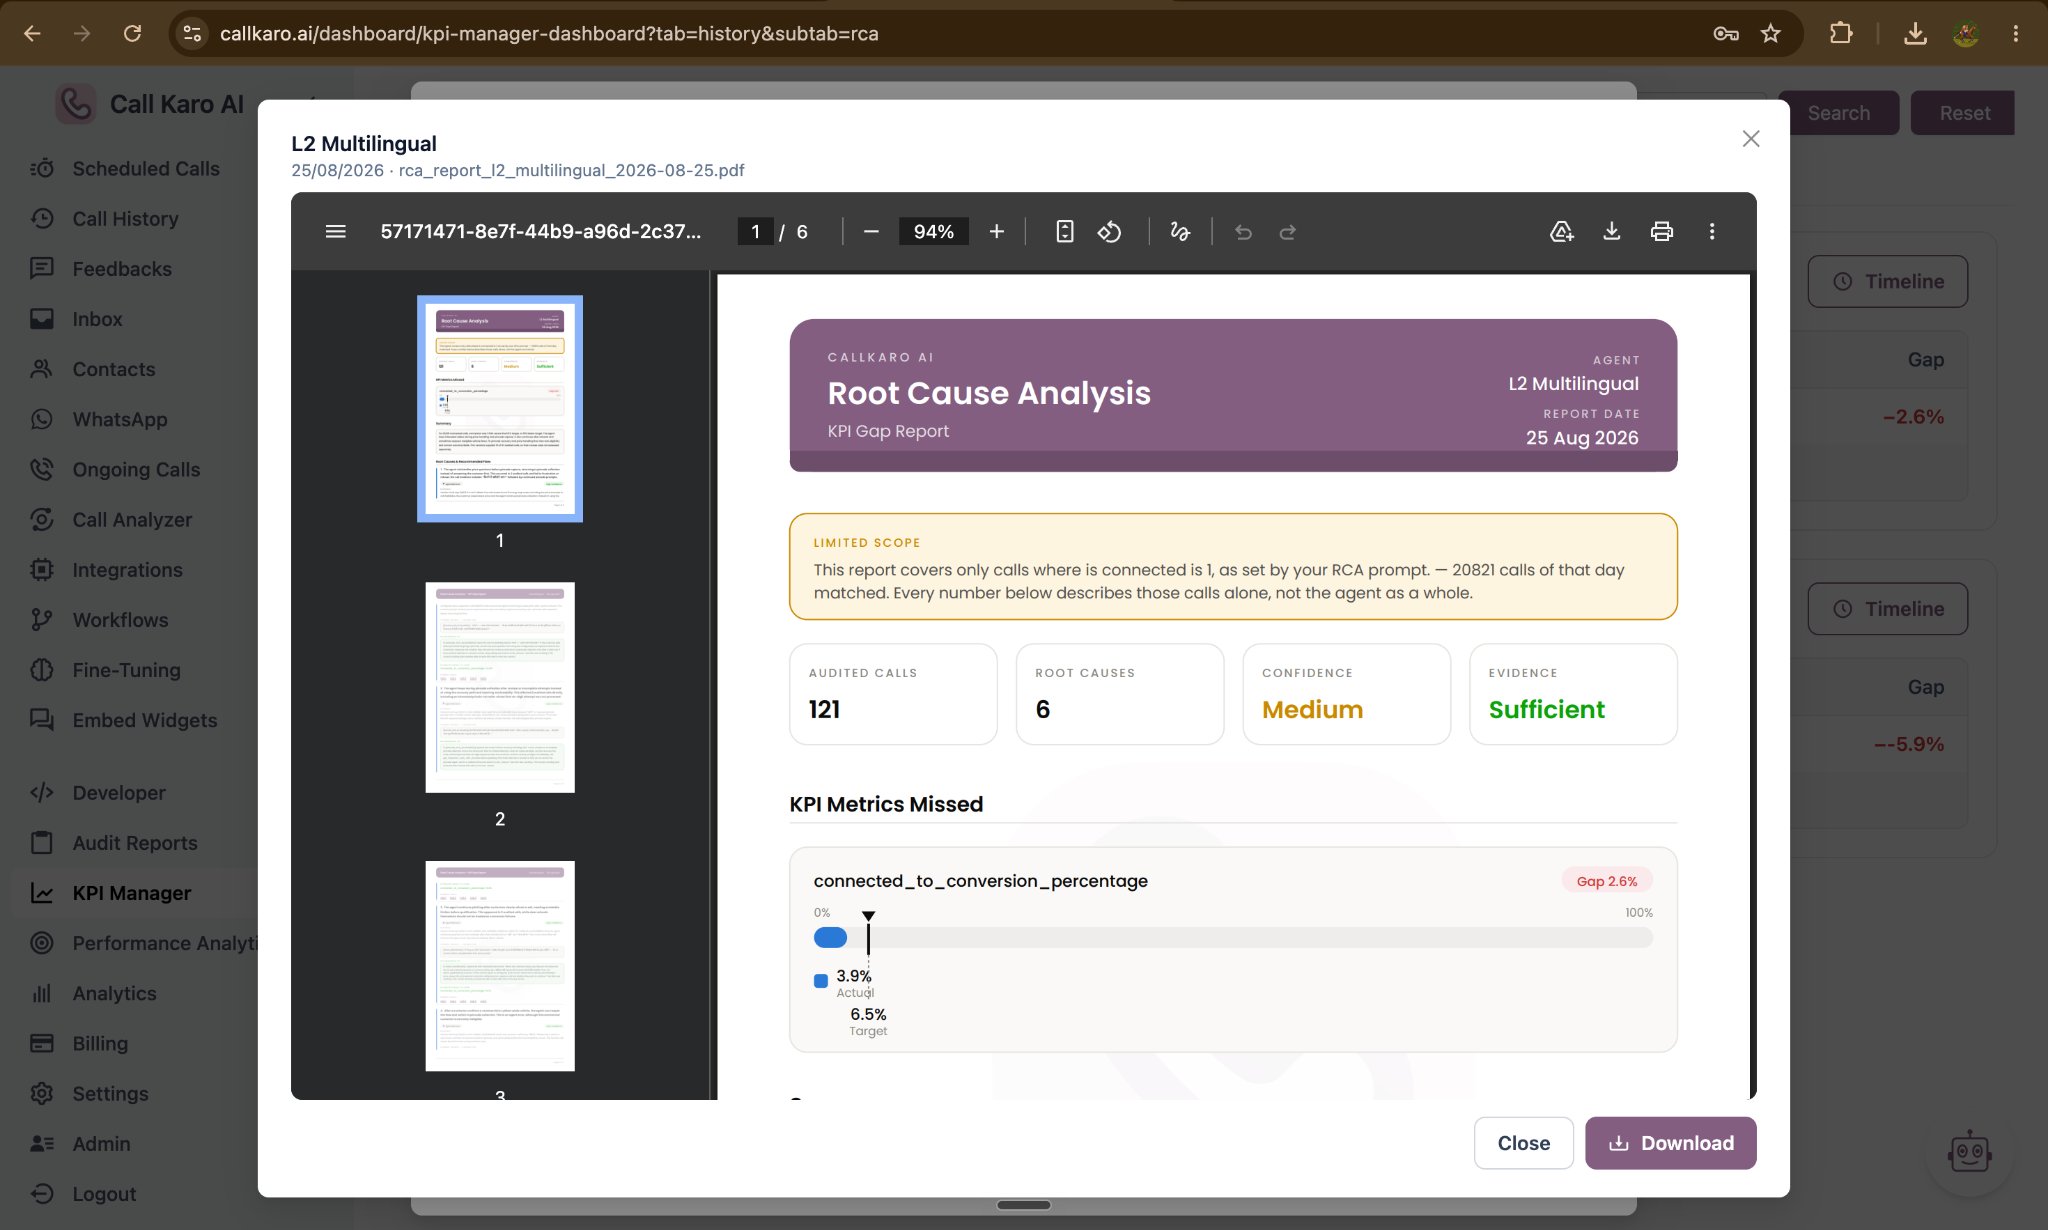
Previewing a report
Select Preview to read the full PDF without leaving the dashboard, or Download to save a copy.